24 March 2020 - 08: 50
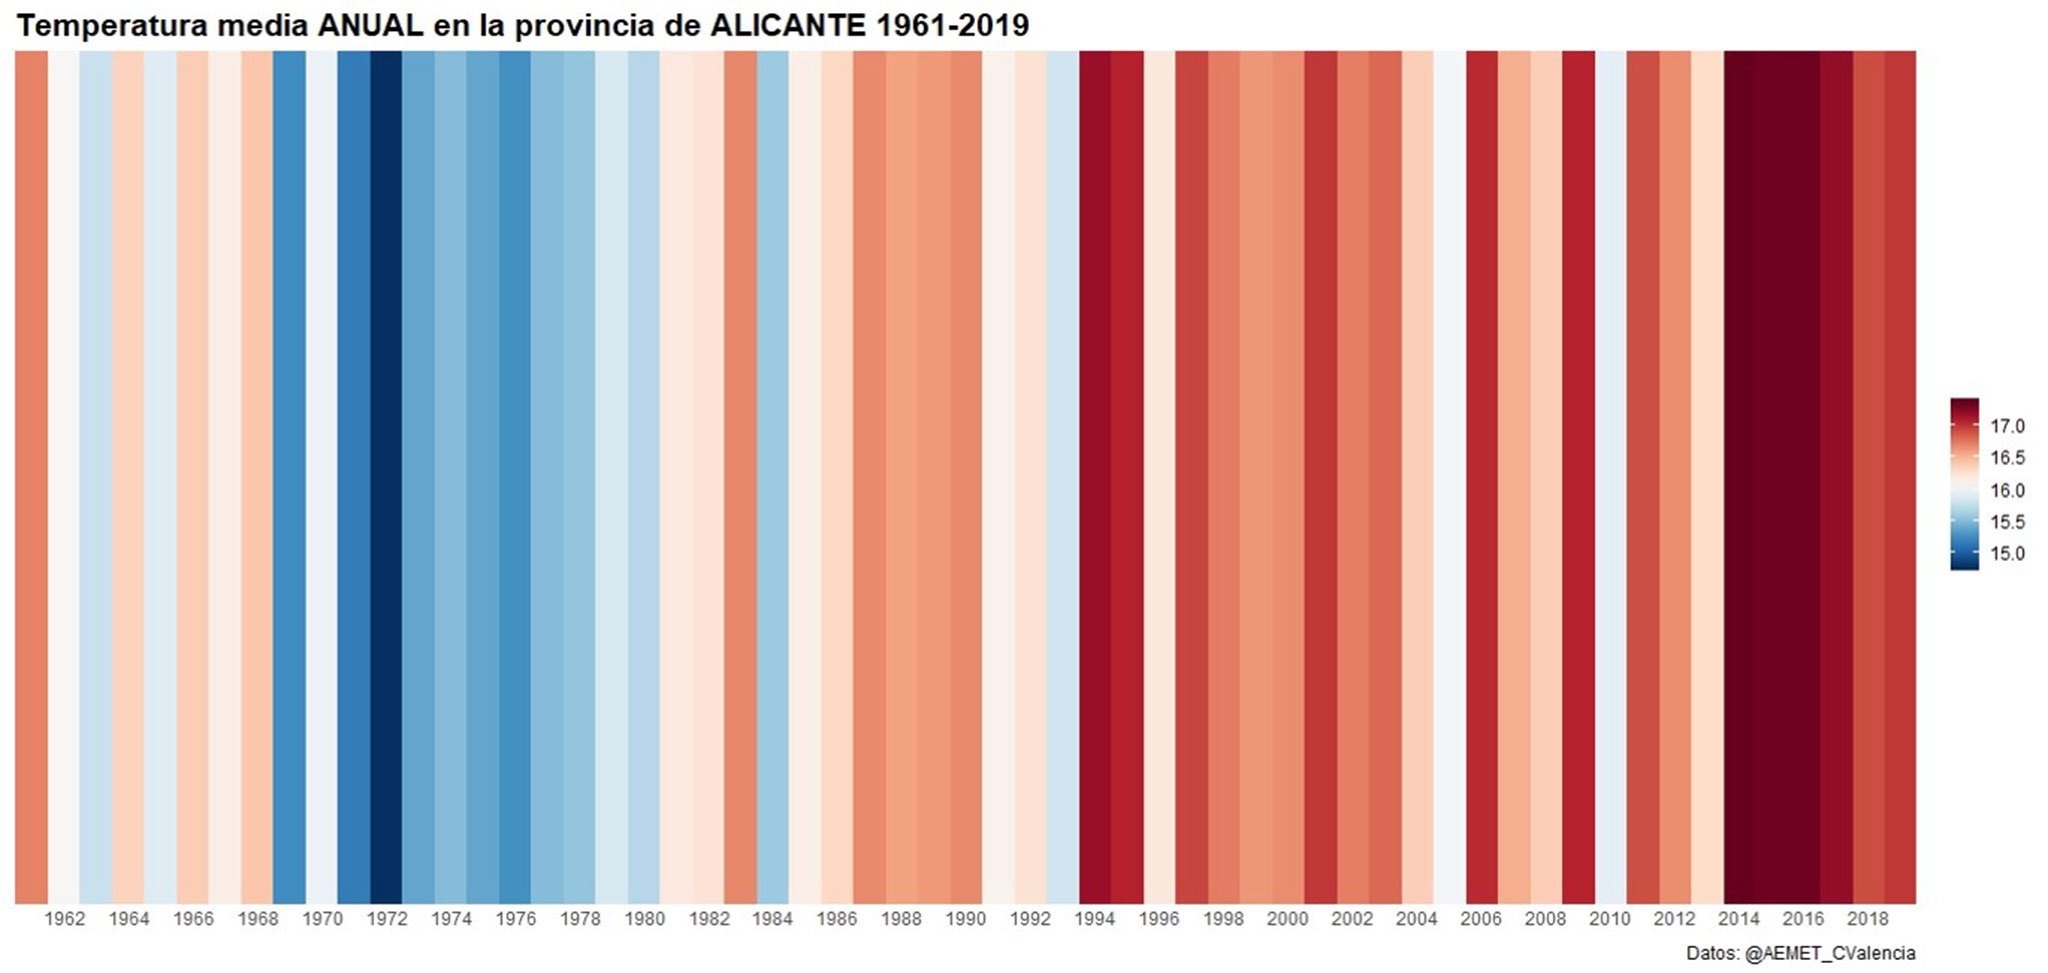
Each bar represents the annual mean temperature in a color code, you can see how the warm years accumulate on the right side of the distribution, that of the most recent years.
See the original article: Is the climate changing? How it would affect us in Dénia
Cookie | Type | Duration | Description |
---|---|---|---|
PHPSESSID | Necessary | The session | Allows SESSION variables to be saved on the web server |
cookielawinfo-checkbox-not-Necessary | Necessary | 11 months | Check if the inclusion of cookies has been previously accepted |
cookielawinfo-checkbox-Necessary | Necessary | 11 months | Check if the inclusion of cookies has been previously accepted |
ls_smartpush | Necessary | 2 days | Allows Litespeed Server to store configurations to improve web performance |
Cookie | Type | Duration | Description |
---|---|---|---|
_ga | Google Analytics | 1 year | It is used to distinguish users. |
_gat | Google Analytics | 1 minute | It is used to limit the percentage of applications. |
_gid | Google Analytics | 1 day | It is used to distinguish users. |